The U.S. Climate Resilience Toolkit team has unveiled an enhanced version of its “Climate Explorer” — a free, web-based mapping and graphing tool providing decision-relevant climate data for every county in the contiguous United States.
“Across the nation, many citizens, business leaders, city planners, and resource managers are seeking to understand and build resilience to costly climate-related hazards,” said David Herring, Communication and Education Division manager within NOAA’s Climate Program Office. “The Climate Explorer is an elegant tool for visualizing a range of past and future climate conditions.”
The Climate Explorer (https://crt-climate-explorer.nemac.org/) provides historical observations and projections for climate variables through 2100. As an integral part of the U.S. Climate Resilience Toolkit (https://toolkit.climate.gov), the tool helps users envision a range of potential future conditions so they can consider and implement climate-smart adaptation strategies.


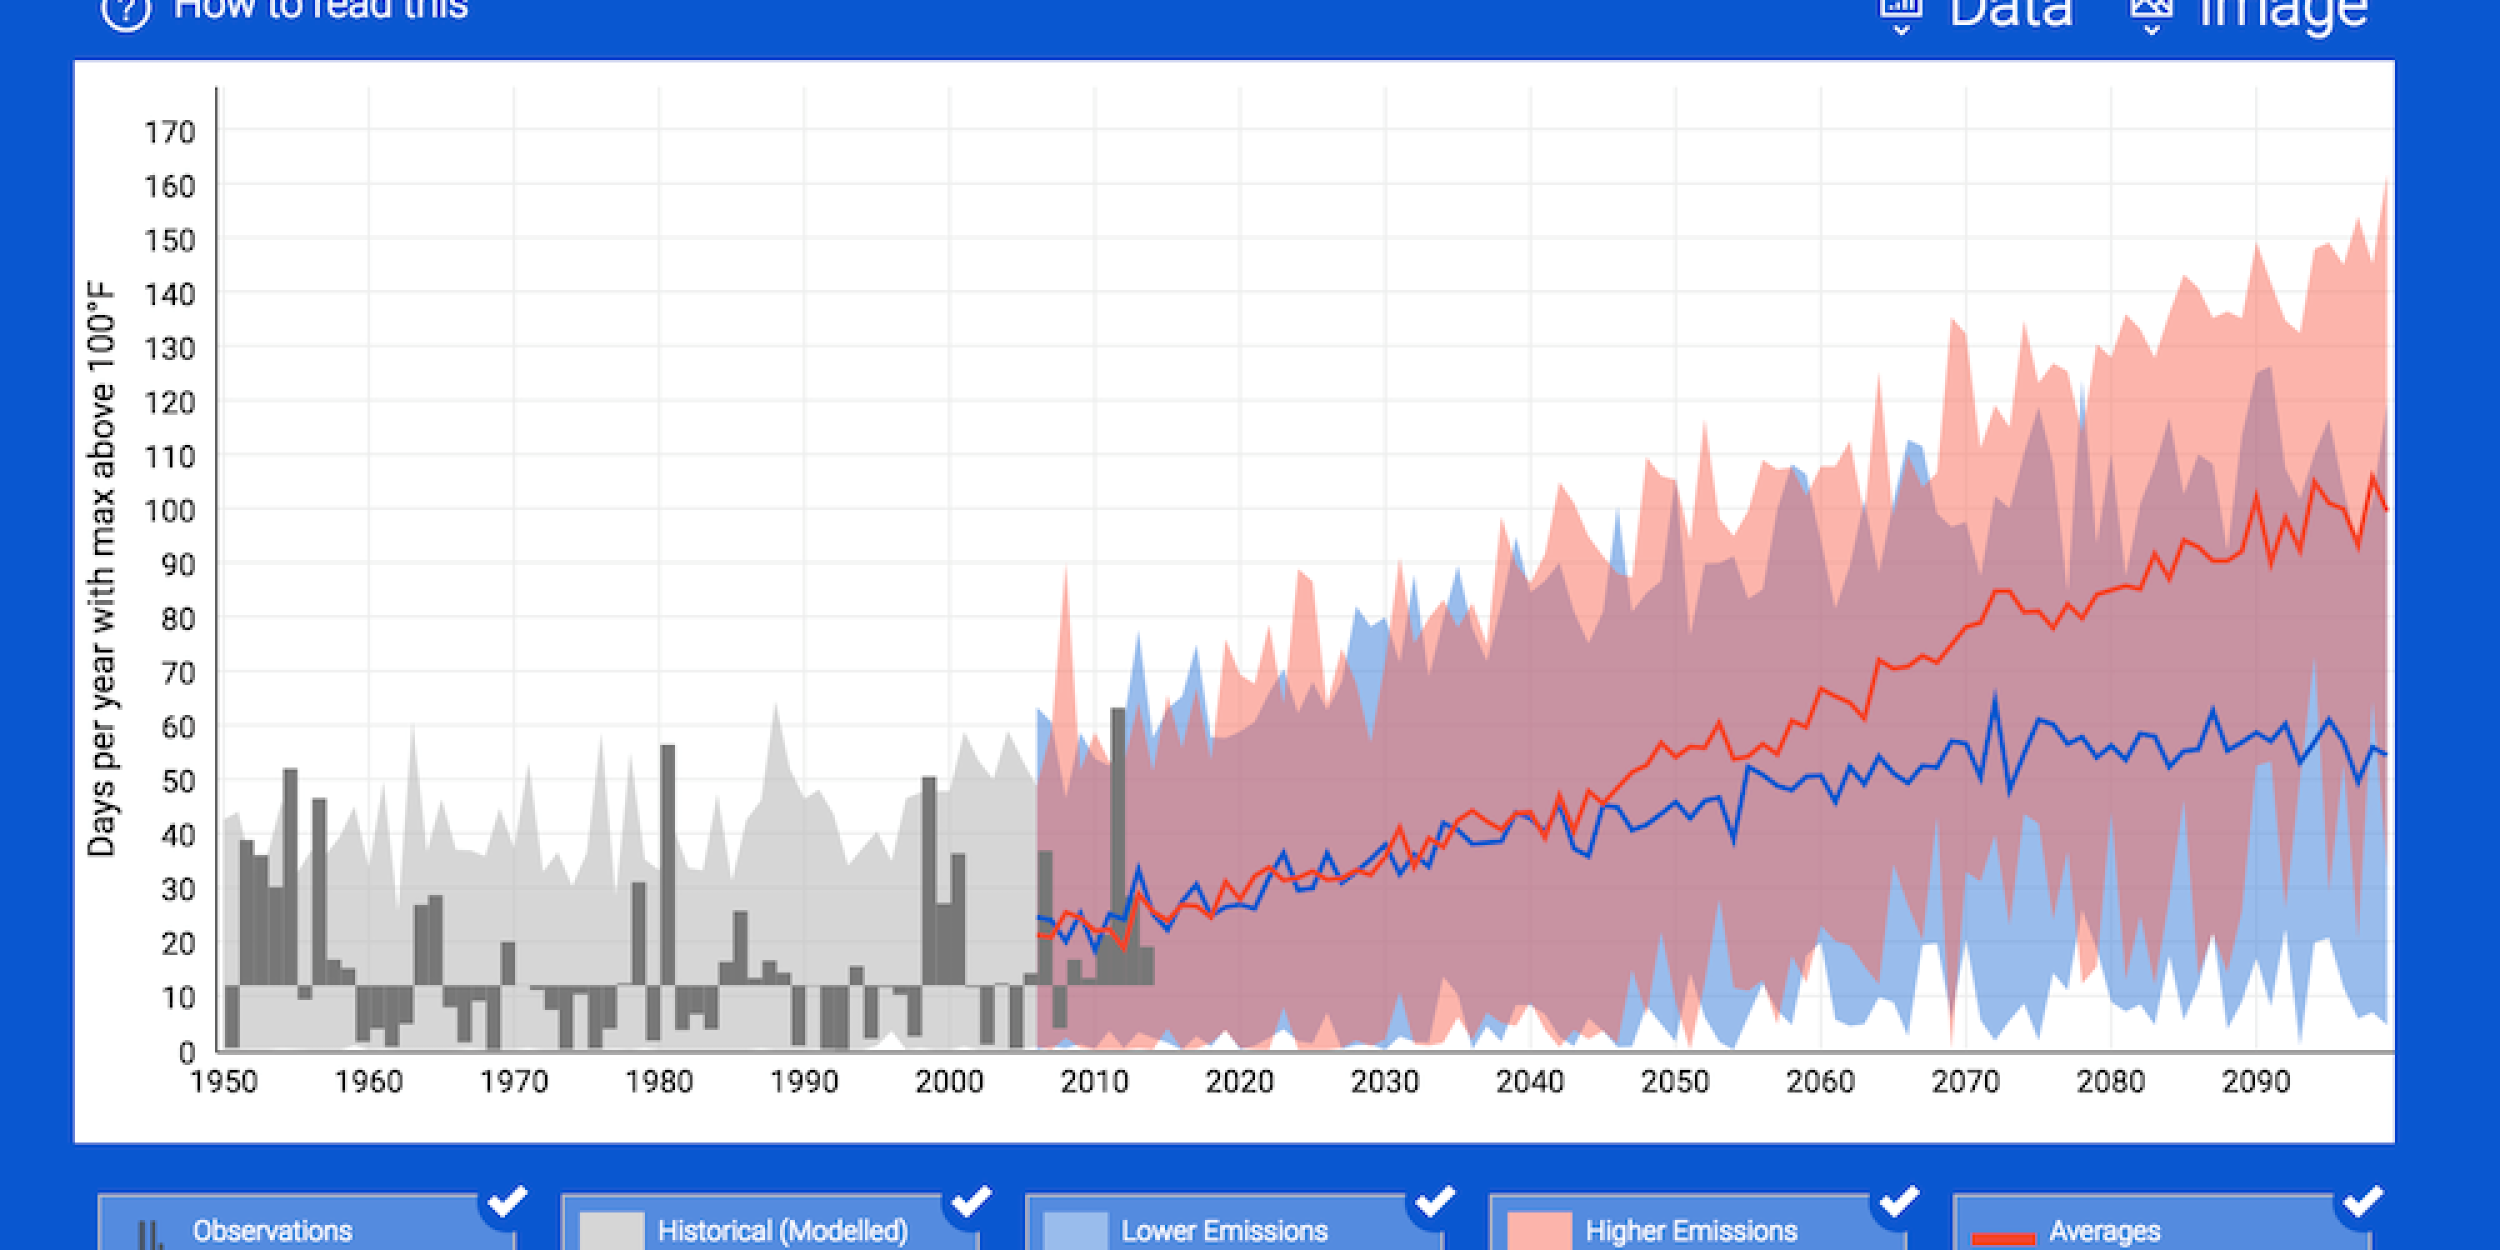
This chart shows historic and projected days per year with maximum temperature greater than 100°F in Dallas County, Texas. The light gray band shows climate model results (hindcasts) for 1950–2005; red and blue bands show climate model projections for 2006–2100. Dark gray bars show observations from 1950 to 2013. Learn more by viewing the chart within the Climate Explorer ».


This chart shows observed and projected frequency of days with high-tide flooding in Washington, D.C. Explore high-tide flooding in the Climate Explorer ».
In the newly enhanced tool, users can:
- explore downscaled projections from the Localized Constructed Analogs (LOCA) dataset, the same dataset used in the 4th U.S. National Climate Assessment;
- check past and projected conditions for 20 decision-relevant variables (increased from 8 variables);
- view the frequency of observed and projected high-tide flooding at more than 80 U.S. tidal stations;
- check when user-defined temperature and precipitation thresholds have been exceeded;
- compare maps of future conditions projected for two scenarios with maps of the recent past;
- download data files with improved labeling and explanations; and
- access the open-source code for the Climate Explorer via GitHub.
“We continue to update and evolve the Climate Explorer in response to user feedback,” said Fred Lipschultz, the Toolkit’s Climate Projections Team Leader based at the U.S. Global Change Research Program (USGCRP). “Later this year, we envision expanding the tool’s coverage to include Alaska, Hawaii, and U.S. island territories in the Caribbean and Pacific.”


Comparison of average maximum daily temperature for Julys from 1961–1990 (left) with conditions projected for Julys in the 2060s under a higher emissions scenario (right). Compare maps in the Climate Explorer ».
The Climate Explorer is managed by NOAA’s Climate Program Office, and was developed under the auspices of the USGCRP in partnership with the Northeast Regional Climate Center at Cornell University, the U.S. Geological Survey, NASA, the Environmental Protection Agency, and the Bureau of Reclamation. The tool was designed by HabitatSeven, programmed by FernLeaf Interactive, and is hosted by the National Environmental Modeling and Analysis Center (NEMAC) at UNC Asheville.


